 School & District Partners
Strategies for Effectively Using CommonLit's Administrator Data
School & District Partners
Strategies for Effectively Using CommonLit's Administrator Data

Your team has purchased CommonLit’s School Essentials PRO Package which is designed to enhance your team’s usage of CommonLit’s award-winning literacy program. As part of this program, your team has access to student rostering and SSO support, CommonLit’s Professional Development Portal, CommonLit’s Assessment Series, and school-wide data reports.
In this blog post, we’ll explore the school-wide data that administrators can access via the admin data dashboard. We’ll also share some tips for leveraging this data with your team.
Logging In and Accessing CommonLit’s Admin Data
Accessing CommonLit’s admin data dashboards is very easy to do. The first step is to go to commonlit.org and log into your account.
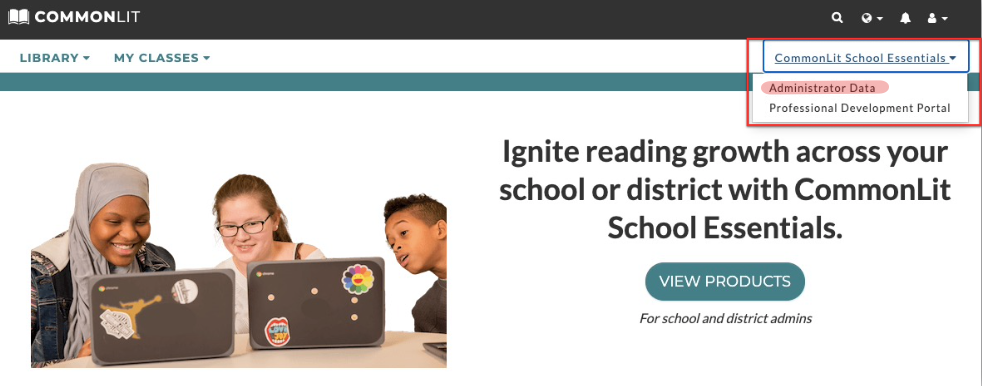
Once you’ve logged into CommonLit, click on the “CommonLit School Essentials” button at the top of the page, and then click on the “Administrator Data” button below. This will allow you to view your team’s data.
School and District Data at a Glance
As soon as you access your team’s data, you’ll begin by seeing a snapshot of your team’s overall data.
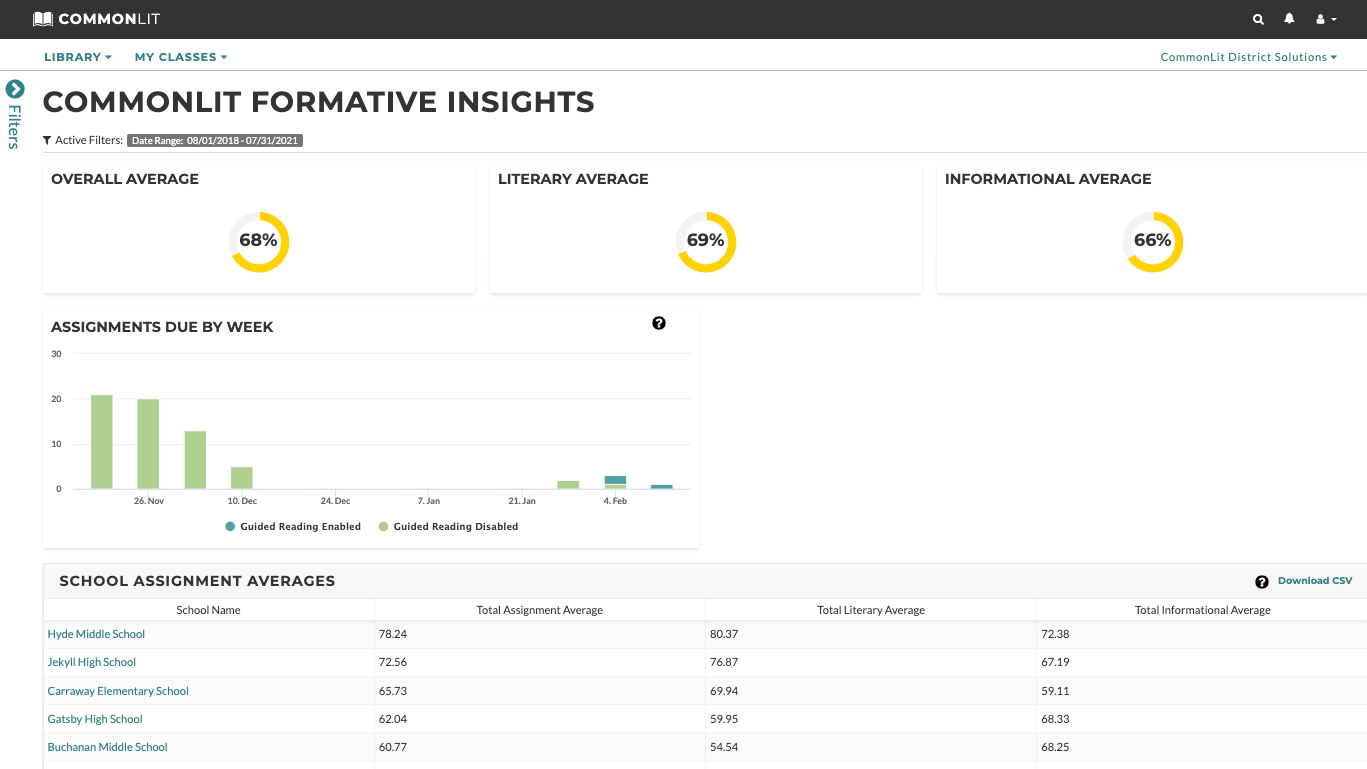
At the very top of the page, you’ll be able to see how students in your school or district are performing on CommonLit assignments and how frequently teachers are assigning CommonLit lessons. If you’re a district administrator, you’ll also be able to view tables that show which schools in your district are utilizing CommonLit the most and how they’re performing in the aggregate on CommonLit lessons.
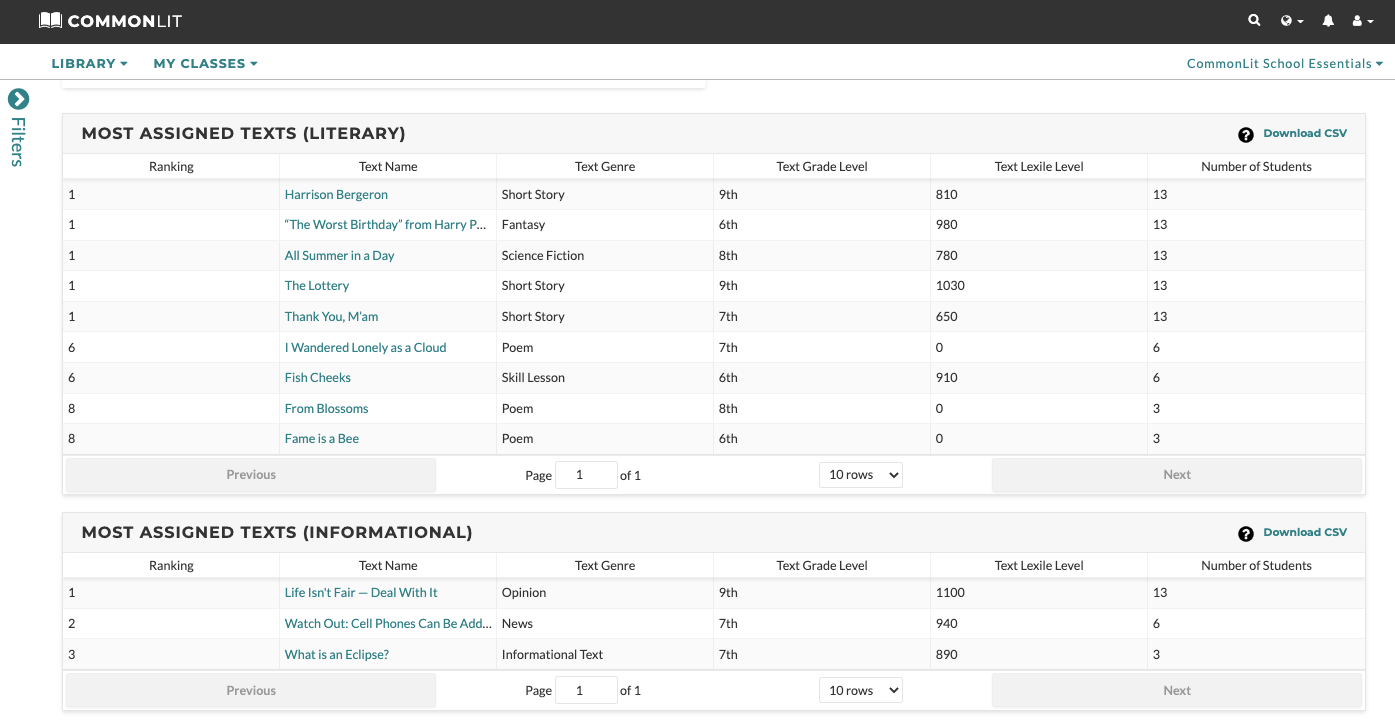
As you scroll down the page, you’ll be able to see which lessons were most commonly assigned by your teachers. To learn more about how students performed on these frequently assigned lessons, just click on any lesson listed in the chart.
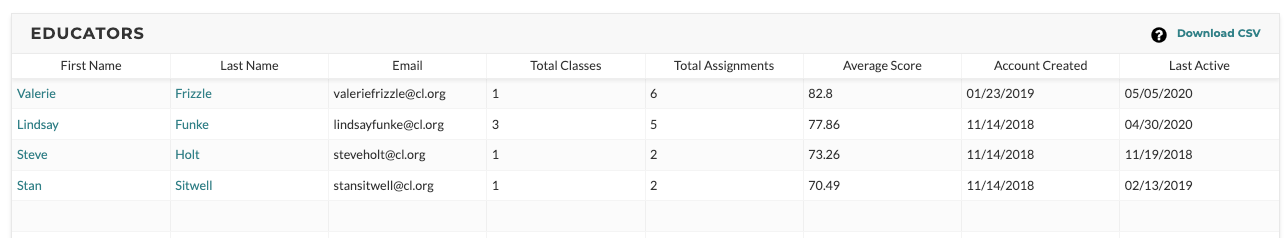
Finally, you’ll be able to see which teachers are most frequently using CommonLit with their students and how their students are performing on CommonLit’s comprehension quizzes. To learn more about how teachers are using CommonLit with their students, just click on one of the names in this chart on your dashboard.
Analyzing a Class’s Performance
In this scenario, I’ve decided to look more closely at how Valerie Frizzle’s students are performing. Once I click on her profile, I see that she is using CommonLit with one of her classes, named the “Porpoises.”
In order to look more closely at the data from this class, I’ve chosen “Porpoises” from the filters on the left side of the screen.
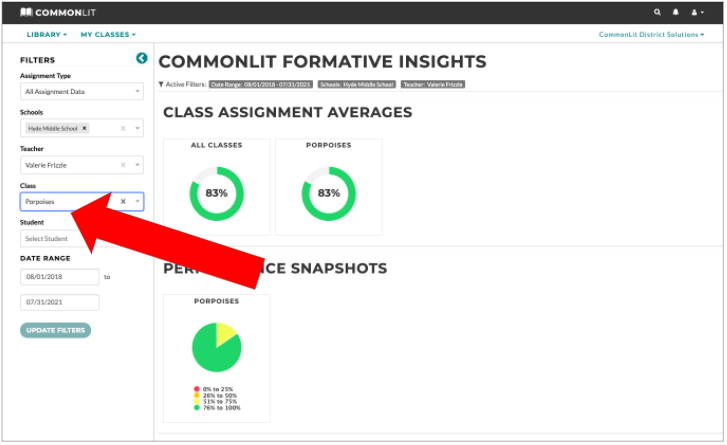
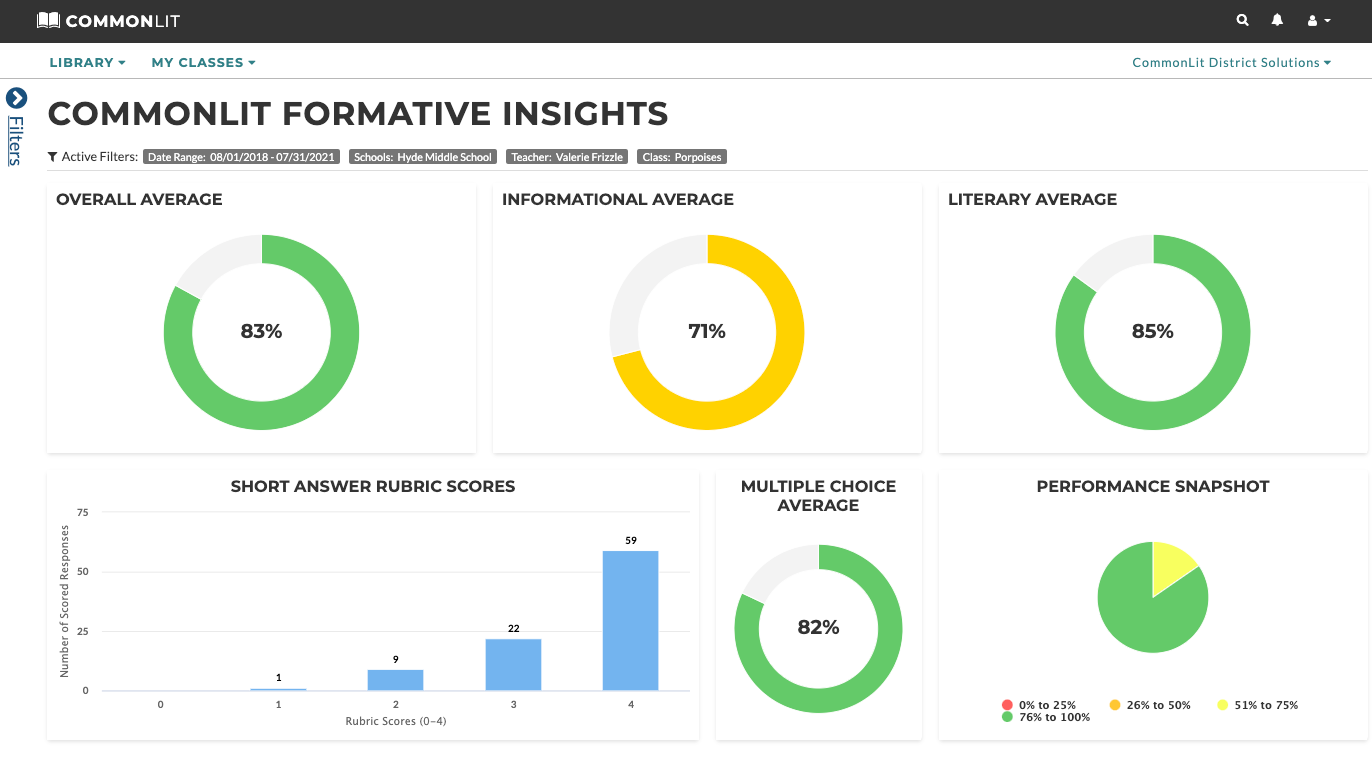
Now that I’ve chosen to look more closely at the “Porpoises,” I have a lot of rich and actionable data at my fingertips. The page begins with some very useful overview data on the class’s performance.
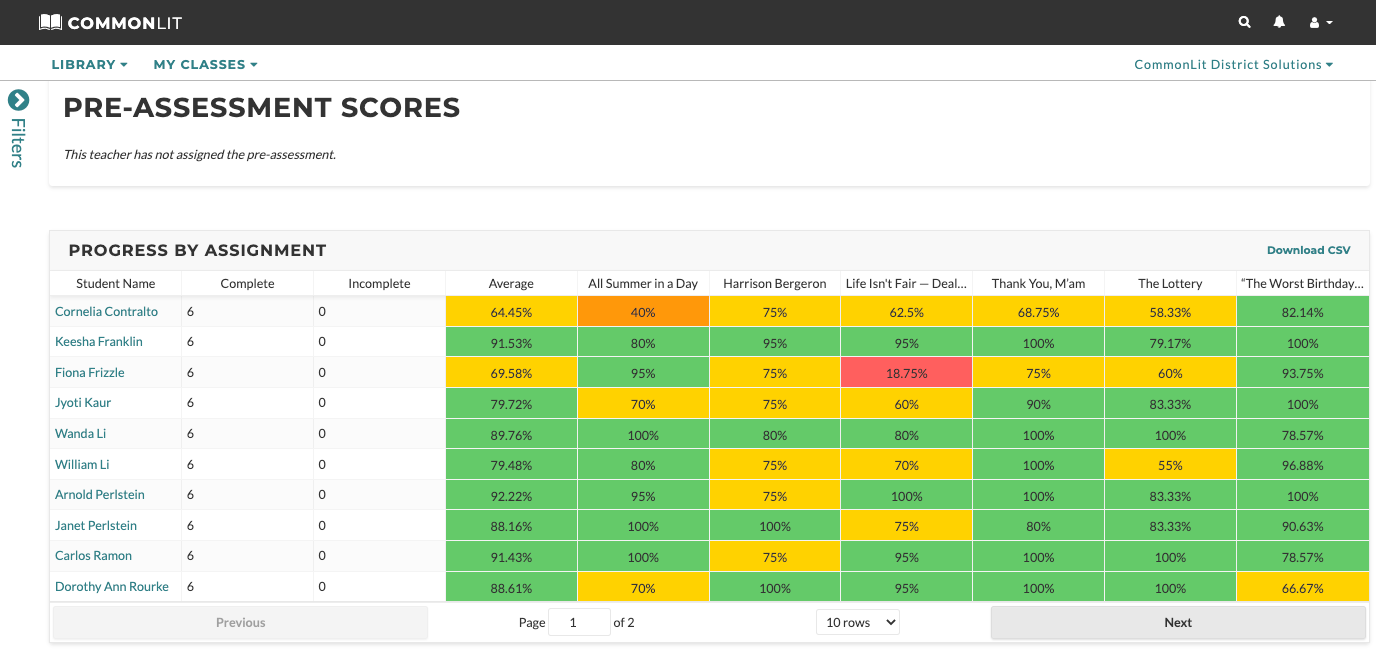
As I scroll down the page, I can view much more granular data. First, I can see if the teacher has assigned CommonLit’s Pre-Assessment. If the teacher has, I can analyze their students’ performance.
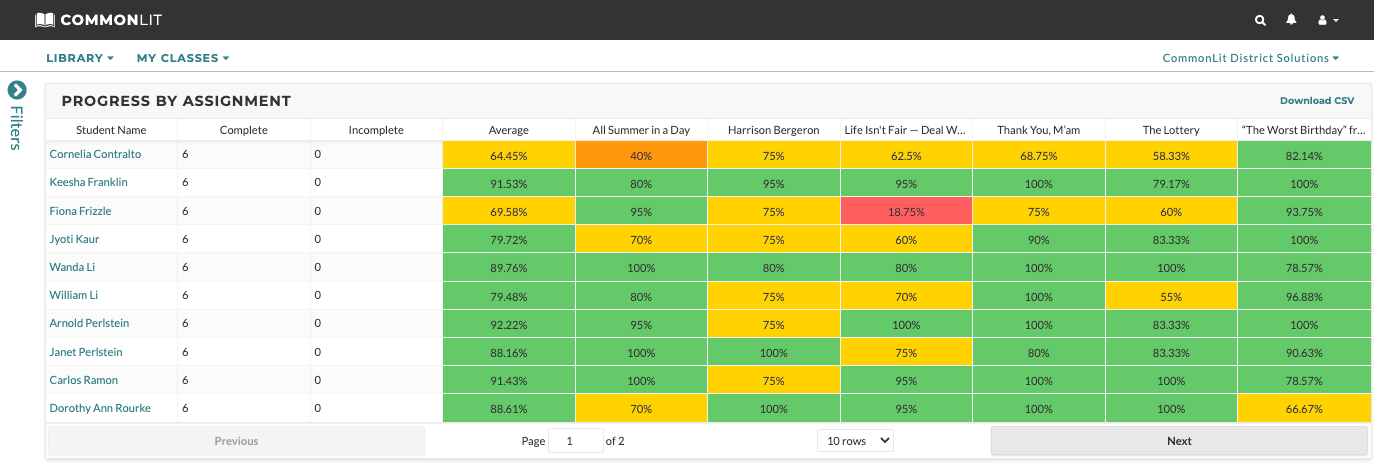
After that, I can see how every student performed on each CommonLit lesson that they have completed. I can also see how many assignments students have failed to complete. This data is extremely helpful for administrators who are looking to quickly understand which students are succeeding and which are struggling.
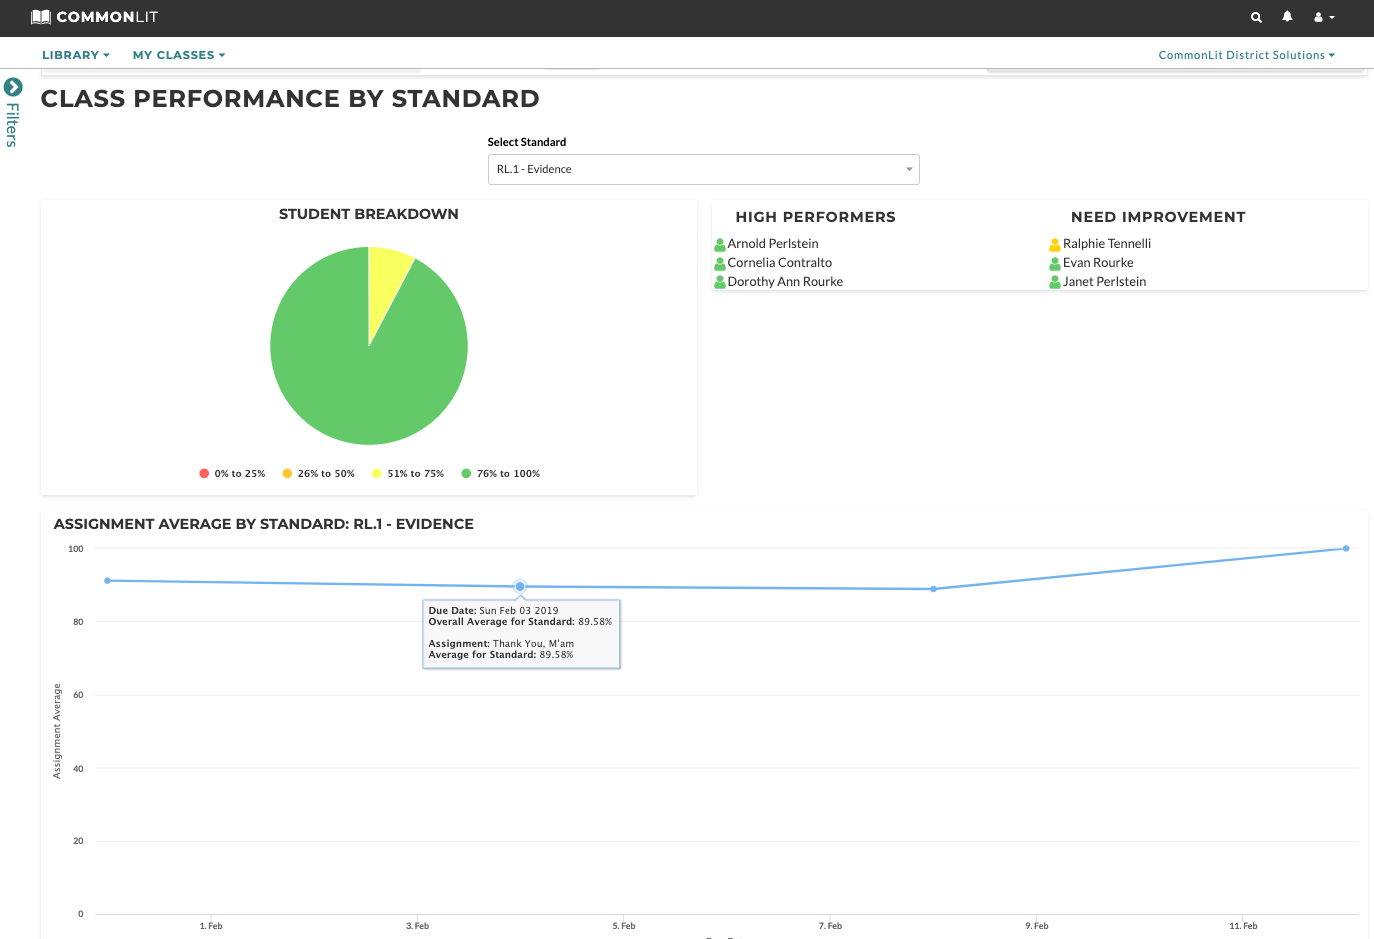
If I go down the page a bit further, I can analyze class performance by standard. In the chart below, you can see how the “Porpoises” are performing on standard RL.1. More specifically, I can see how the class’s students have performed each time they’ve practiced that standard. I can also choose to go a level deeper and see how each student is performing by standard.
Digging Deeply into a Student’s Performance
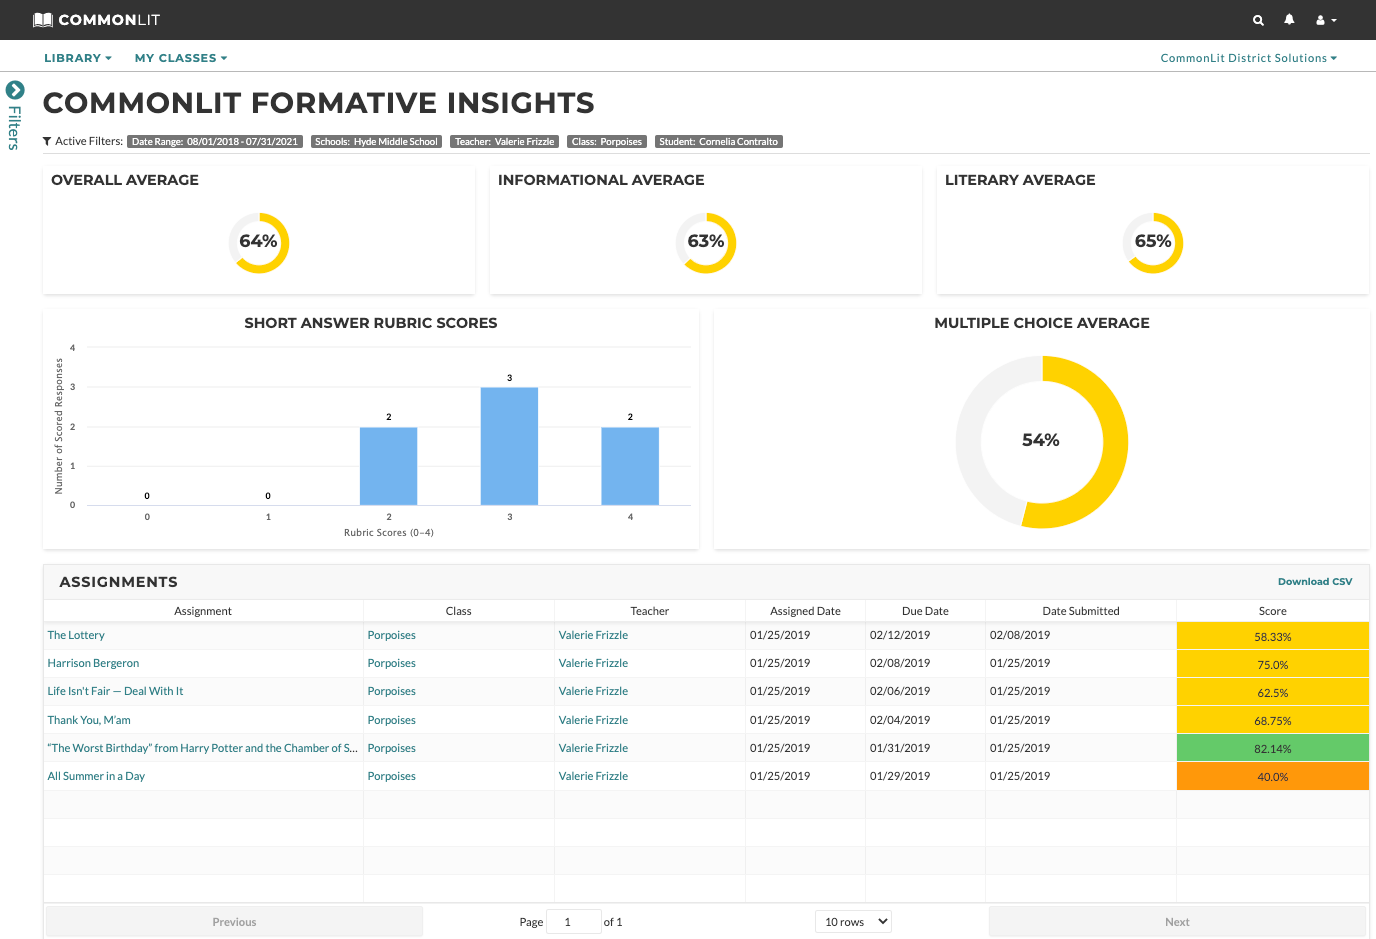
After analyzing the class’s overall performance, I’ve chosen to look more specifically at Cornelia Contralto’s data since she is scoring just 64% on CommonLit assignments.
To access her full data report, I can click on her name in the chart below:
Now that I’m viewing Cornelia’s data report, there is a myriad of data to view. I can see Cornelia’s overall data on reading and writing lessons. I can also see when she completed each assignment.
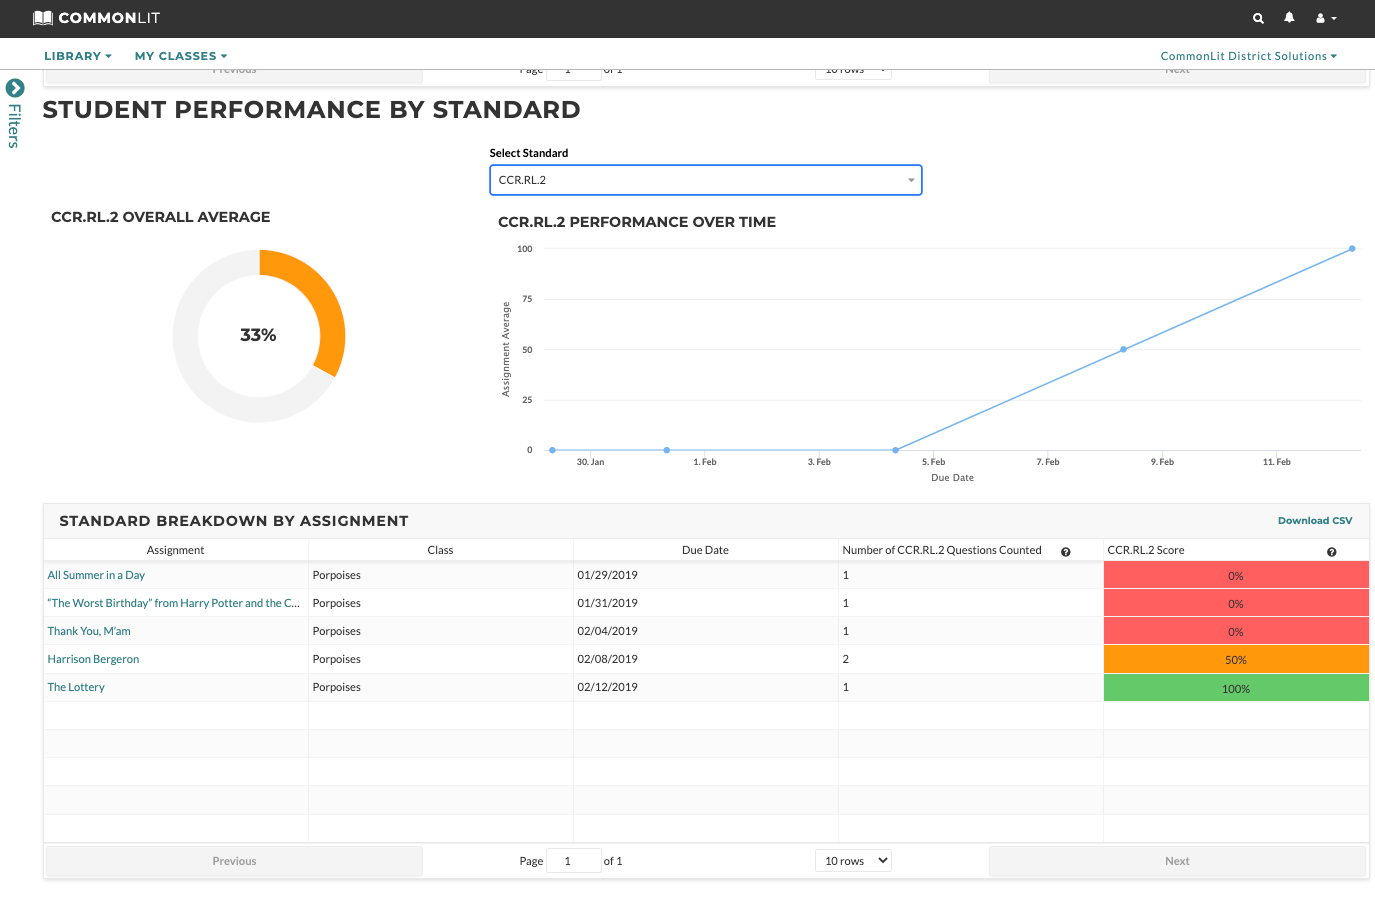
If I scroll down further, I can see how Cornelia is performing by standard. Using this visualization, I can see that Cornelia has really struggled on standard RL.2. She’s only answered RL.2 questions right 33% of the time. As an instructional leader, I can quickly diagnose specific gaps in her learning.
Analyzing School or District-wide Performance on a Commonly Taught Lesson
Another powerful way to analyze student performance is to see how students across your school or district performed on a commonly taught lesson. With this visualization, you’re able to track student performance across classrooms. Here’s how it works:
From the homepage of your admin data portal, choose one of the CommonLit lessons that has been digitally assigned to students. (You can also use the filter bar on the left side of the page if you prefer.)
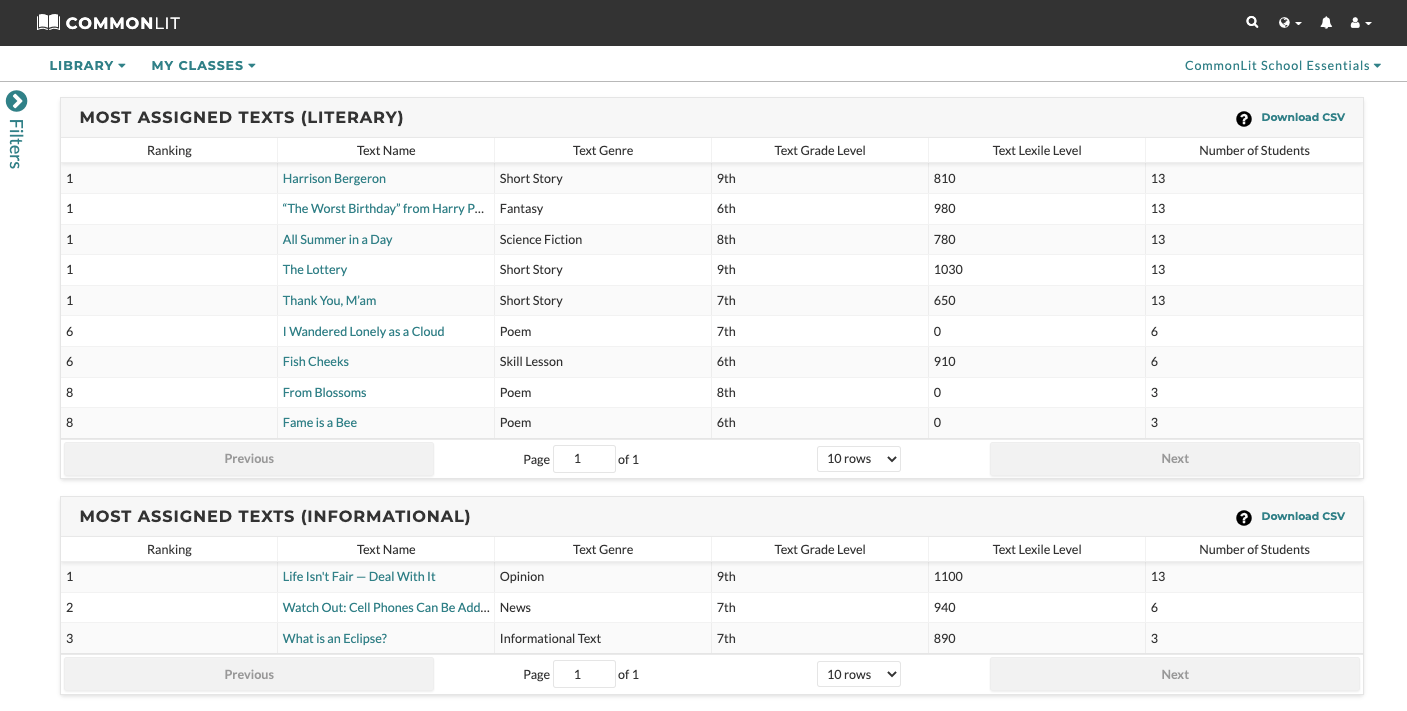
Today, I want to look more closely at how students performed on “All Summer in a Day” by Ray Bradbury, so I’ll click on that text in the chart above. This series of charts (below) provides me with easy-to-digest data; I can quickly see how students have performed on this lesson, and how students across the school have performed on other literary texts.
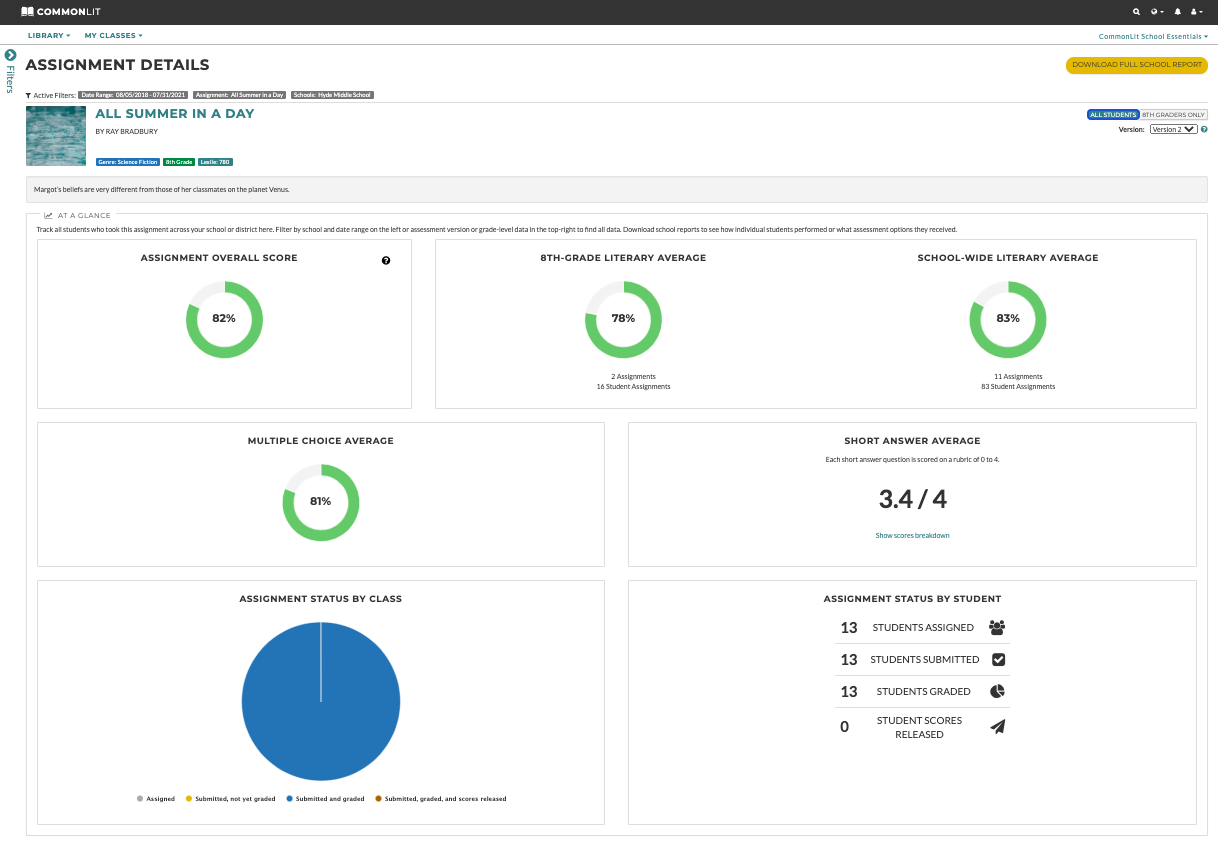
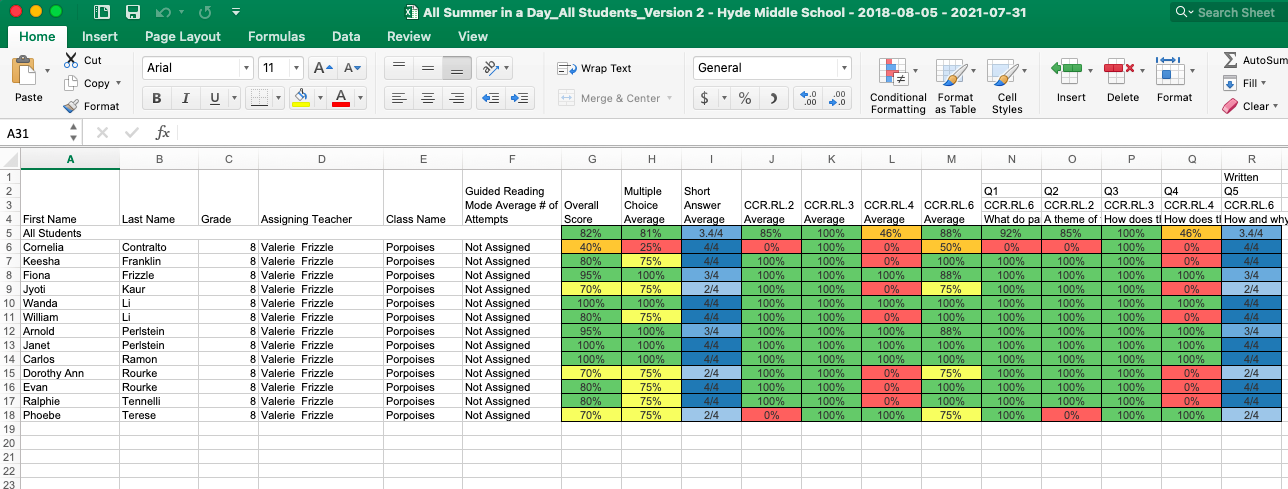
For much more granular data, I can download a CSV report by clicking the gold “Download Full School Report” button located at the top right corner of the page. This CSV report is available when you filter by a school and includes detailed student data, performance by question, and standards-based data.
Next Steps
When viewing this data, keep in mind that the CommonLit library offers over 2,000 reading lessons that can be filtered by grade level, theme, standard, and more. When supporting your teachers, we recommend navigating through the CommonLit library with them and helping them identify lessons they can utilize to meet student needs.
Our District Success team at CommonLit is eager to help you fully leverage CommonLit and the School Essentials PRO Package with your team. If you have any questions, please reach out to us at help@commonlit.org.